Pivot Tables are the most powerful tool available in Excel. Amazingly, they are also one of the easiest tools to learn!
How is it possible that a tool that is so powerful can also be so easy to learn?
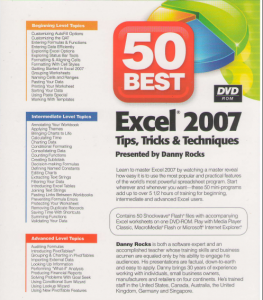
Let me make it easy for you to learn how to create Excel Pivot Table Reports and Charts. My name is Danny Rocks and I created the best selling video tutorial on a DVD-ROM, “The 50 Best Tips for Excel 2007.” On my DVD, I have created these video tutorials to help you to create Pivot Tables:
Introducing Pivot Tables – Run time: 8:23
- Why Use Pivot Tables?
- How to Create a Pivot Table
- How to Modify a Pivot Table
- How to Update a Pivot Table
Using New Pivot Table Features – Run time: 7:46
- Use Excel Table as the Data Source for a Pivot Table
- Apply Conditional Formatting to a Pivot Table
- Adjust Pivot Table Report Layouts
- Insert Blank Rows in Pivot Table Reports
Grouping and Charting in Pivot Tables – Run time: 5:50
- Grouping by Month, Quarter and Year in a Pivot Table
- Grouping by Week in a Pivot Table
- Collapsing & Expanding Fields in Pivot Tables
- Creating Pivot Charts
I guarantee your satisfaction 100%! If you are not completely satisfied with your purchase, I will refund your purchase with no questions asked!

Link to this post!


