Quickly Fill In all Blank Cells in Excel Report

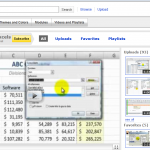
Frequently clients will show me a report that they have downloaded from a Main Frame Computer or a Database Report. The report contains multiple blank cells. In order for my client to insert a Pivot Table or to perform Subtotals, they must fill in the blank cells by copying the value for the cell above. I have watched, in amazement, as clients copy and paste – or even type in – the missing values. There is an efficient way to perform this task. Here are the Excel Concepts that I cover in this short – 3 minute – Excel video training lesson:

  • Go To Special – Current Range
  • Go To Special – Blank Cells
  • Use Ctrl + Enter to register the formula into each cell in the selected range
  • Copy, Paste Special Values to convert formulas to values

This tip will save you lots and lots of time and prevent careless data entries. If you like this tip, I have 50 similar tips to offer you on my DVD, “The 50 Best Tips for Excel 2007.” Click here to add my DVD to your Shopping Cart.

Learn how you can “Master Excel in Minutes – Not Months!”

Share and Enjoy:
  • Add to favorites
  • Facebook
  • Twitter
  • Technorati
  • Print
  • email
  • Digg
  • StumbleUpon
  • del.icio.us
  • Yahoo! Buzz
  • Google Bookmarks
  • Orkut
  • SphereIt
  • Sphinn

Consolidate Data from Multiple Excel Workhseets Part 2

In Part One, I showed you how to Consolidate Data By Position –  where the range of cells was consistent in each of the Excel worksheets –  Click on this link to go to this lesson.

Consolidate Data By Category

In this lesson, I show you how to Consolidate Data By Category / By Label. You use this technique when the number of rows or columns containing values varies from worksheet to worksheet. For example, the number of sales representatives reporting may change each month. Or, some of the worksheets that you receive contain an extra column that you want to include in your consolidation. Consolidating Data by Category is very flexible as you will see in this lesson.

Learn how to “Master Excel in Minutes – Not Months!”

Share and Enjoy:
  • Add to favorites
  • Facebook
  • Twitter
  • Technorati
  • Print
  • email
  • Digg
  • StumbleUpon
  • del.icio.us
  • Yahoo! Buzz
  • Google Bookmarks
  • Orkut
  • SphereIt
  • Sphinn

View My Excel Training Videos on YouTube

DannyRocksExcels on YouTube

YouTube

Two years ago, in August 2010, I started uploading my Excel video training lessons to my YouTube Channel – DannyRocksExcels. Now there are 93 Excel videos available. I was originally reluctant to post my video content on YouTube because I selfishly wanted to restrict my videos to my own website. After a conversation with a colleague, I changed my mind and began to upload all of my Excel videos to YouTube.
Why?
  • YouTube attracts a much more diverse audience than I could ever hope to attract on this website.
  • YouTube makes it easy to download and share my videos with others.
  • YouTube has a great analytics program – Insight – that allows me to gain valuable information about my audience.
  • YouTube is now showing several of my most popular videos as ads automatically (via Google AdSense)
  • I have good interaction with my viewers on YouTube – comments, requests for new videos, etc.

When I look at the numbers on YouTube I am amazed!

Here is a summary:

  • My Excel Videos have been viewed almost 200,000 times over the past two years.
  • One Video (Introduction to Pivot Tables) has been viewed over 20,000 times!
  • My DannyRocksExcels Channel on YouTube now has over 500 subscribers.

I invite you to view, download or subscribe to my YouTube Channel for Excel Training videos by following this link.

Thank you!

Danny Rocks

P.S. Learn how to “Master Excel in Minutes – Not Months!”

Share and Enjoy:
  • Add to favorites
  • Facebook
  • Twitter
  • Technorati
  • Print
  • email
  • Digg
  • StumbleUpon
  • del.icio.us
  • Yahoo! Buzz
  • Google Bookmarks
  • Orkut
  • SphereIt
  • Sphinn

Summarize Multiple Excel Worksheets – Consolidate Data By Position

There are many ways to Summarize the data that is stored in multiple Excel Worksheets or Workbooks. Pivot Tables are great for producing summaries. However, many people do not use – or do not know how to use – Pivot Tables, so let me demonstrate how to use Excel’s Consolidate Data Tool to get the job done.

Consolidate Data By Position

In this scenario, I will take the data from four identical worksheets and consolidate the sales numbers in a new worksheet. First, without using a “Link” to keep the data in the consolidated worksheet current and then I show you how to create a link to the Source Data.

But… there is a “Got’cha Step” when you link sources. It is possible to “double your sales numbers” without realizing it! This might make you feel good when you first see this. However, this is not good – when you are found out. And, trust me on this, someone will definitely find this error!

SUM Across Group of Excel Worksheets

As a bonus, I include another technique to SUM cells from multiple worksheets. Watch as I show you this “trick” – how to use the SUM() Function to total data across a contiguous group of Excel worksheets. It really is a great tip to learn!

Watch My Video on YouTube

Follow this link to watch my tutorial on my YouTube Channel – DannyRocksExcels

Related Video Tutorials

I continue this lesson on Data Consolidation in Part Two. Click on this link to see how to Consolidate Data By Category.

Watch my Video on iTunes

You can download and view this Excel Training Video at the iTunes Store. Follow this link to subscribe to the “Danny Rocks Tips and Timesavers” podcast.

My Video Training Resources

You can learn “The 50 Best Tips, Tricks and Techniques for Excel 2007” when you purchase my DVD – ROM!

Learn how to “Master Excel in Minutes – Not Months!”

Share and Enjoy:
  • Add to favorites
  • Facebook
  • Twitter
  • Technorati
  • Print
  • email
  • Digg
  • StumbleUpon
  • del.icio.us
  • Yahoo! Buzz
  • Google Bookmarks
  • Orkut
  • SphereIt
  • Sphinn

Excel Training Videos by Category

Here is a listing, by category – with hyperlinks – to the free Excel Training Videos that I offer on The Company Rocks website. Simply click on the hyperlink for each Category to go directly to the Archive of Excel videos in that category. 

Note: Some of my Excel Videos are listed in multiple categories.

Excel Tip List

Excel Tips

The companion page to this one is, “Index of Excel Video Training Lessons.” In the Index you will see the title of each Excel Video Tutorial listed beneath the category.

If you like the free videos that I offer, I guarantee that you will enjoy my DVD – “The 50 Best Tips for Excel 2007” – now on sale here on my website.

Learn how you can “Master Excel in Minutes – Not Months!”

Learn how to quickly “Create Pivot Tables and Charts.”

Excel Training Video Lessons – by Category:

“The 50 Best Tips for Excel 2007” DVD is now on sale!

Share and Enjoy:
  • Add to favorites
  • Facebook
  • Twitter
  • Technorati
  • Print
  • email
  • Digg
  • StumbleUpon
  • del.icio.us
  • Yahoo! Buzz
  • Google Bookmarks
  • Orkut
  • SphereIt
  • Sphinn

Perform Break Even Analysis with Excel’s Goal Seek Tool

As a small business owner or investor, you ask many“what-if?” questions. In preparing to present your business plan to an investor you want to know your “break even” point. Fortunately, Excel has a great tool – Goal Seek – that can save you time by creating multiple scenarios to help you determine your goal – to break even!

You can watch this Excel Video Lesson here – online – or you can download it to watch later, at your convenience. I invite you to subscribe to my podcast, Danny Rocks Tips and Timesavers” at the iTunes store by clicking this link – this is a free subscription.

Click here to see a listing of “The 50 Best Tips for Excel 2007.”

Learn how you can “Master Excel in Minutes – Not Months!”

Share and Enjoy:
  • Add to favorites
  • Facebook
  • Twitter
  • Technorati
  • Print
  • email
  • Digg
  • StumbleUpon
  • del.icio.us
  • Yahoo! Buzz
  • Google Bookmarks
  • Orkut
  • SphereIt
  • Sphinn

Use Excel’s Goal Seek to Find Formula Error

A viewer wrote me seeking help with a formula. He was calculating a monthly payment for a loan using Excel’s PMT() Function and he was surprised at the result of the formula. I reviewed his formula and discovered that it was not a “formula problem.” Rather, it was a “results problem!” Watch this short video to see how I solved this problem for my viewer by using Excel’s “Goal Seek” tool. So now, instead of a monthly payment of $10,666.67, the result is $501.38 – a very different result!

You can download this video – for free – here on my website. Just click the button below the video image.

You can also subscribe to my Podcast, “Danny Rocks Tips and Timesavers” at the iTunes Store.

You can “Master Excel in Minutes – Not Months!”

Share and Enjoy:
  • Add to favorites
  • Facebook
  • Twitter
  • Technorati
  • Print
  • email
  • Digg
  • StumbleUpon
  • del.icio.us
  • Yahoo! Buzz
  • Google Bookmarks
  • Orkut
  • SphereIt
  • Sphinn

Two Ways to Produce an Executive Summary of an Excel List

On one of the technology blogs that I follow, there is a debate over the best way to produce an Executive Summary of the information in an Excel Data List. Some people like the idea of using Excel’s =SUMIF() Function for this while others recommend creating a Pivot Table as the summary.

You decide – after watching this short video demonstration using both approaches. And, add a comment or drop me an email to let me know your thoughts.

This Excel Video Lesson is available for you to download as a Podcast on iTunes.

Follow this link to go to the “Danny Rocks Tips and Timesavers” podcast.

Learn how to “Master Excel in Minutes – Not Months!”

Share and Enjoy:
  • Add to favorites
  • Facebook
  • Twitter
  • Technorati
  • Print
  • email
  • Digg
  • StumbleUpon
  • del.icio.us
  • Yahoo! Buzz
  • Google Bookmarks
  • Orkut
  • SphereIt
  • Sphinn

Show Percentage of Calculations in Pivot Tables

Most people are content to let a Pivot Table Sum, Average, or Count their Values Fields. But what if you want to see individual Products as a percentage of all products sold in a Region – this is a standard request for Excel. And … it is easy to perform this calculation in a Pivot Table. Let me show you how to do this.

Follow this link to subscribe to the Danny Rocks “Tips and Timesavers” Podcast at the iTunes Store.

Learn how to “Quickly Create Pivot Tables and Charts in Excel.”

Share and Enjoy:
  • Add to favorites
  • Facebook
  • Twitter
  • Technorati
  • Print
  • email
  • Digg
  • StumbleUpon
  • del.icio.us
  • Yahoo! Buzz
  • Google Bookmarks
  • Orkut
  • SphereIt
  • Sphinn

How to Import Text and Database Files in Excel 2007

When you need to import a Word document or an Access database file in Excel, resist the temptation to simply “open” the file with Office Button (File) – Open. Rather, follow the steps to “Get External Data” from the Data Tab on the Ribbon. This is how you can control the data type of each field that you import – especially important for formatting fields that contain dates. You also can control – and preview – who Excel will distribute the data into individual columns before you import the file.

Watch as I demonstrate these steps – this tip will save you a lot of time and avoid frustration.

(Note: This is a re-posting so that I can feed this video lesson to my Podcast at the iTunes store.)

Follow this link to view or subscribe to the “Danny Rocks Tips and Timesavers” podcast at the iTunes store.

Learn how to “Master Excel in Minutes – Not Months!”

Share and Enjoy:
  • Add to favorites
  • Facebook
  • Twitter
  • Technorati
  • Print
  • email
  • Digg
  • StumbleUpon
  • del.icio.us
  • Yahoo! Buzz
  • Google Bookmarks
  • Orkut
  • SphereIt
  • Sphinn