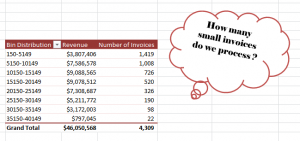
Has your manager ever asked you, “How many small invoices do we process?” Of course, you do not know that number immediately. However, you can produce the answer within about 2 minutes when you use an Excel Pivot Table.
Amazing?
Group Fields in a Pivot Table
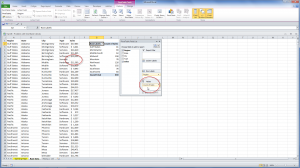
Yes. And, easy to produce thanks to the “Group Fields” tools in an Excel Pivot Table – in any version of Excel!
In fact, I demonstrate how to produce the frequency distribution in:
- Excel 2010 / Excel 2007
- Excel 2003
Download My Pivot Table Video Recordings
This give me the opportunity to announce that I have published a series of Video Tutorial Recordings for Excel Pivot Tables – on my WebEx by Cisco website – that you can download for only $9.95 USD!
Follow this link to get more information and to follow the direct links to download these recordings.
It is so easy to produce this Pivot Table report that you will be amazed – and want to learn more. That is why I have decided to produce a sequel to this lesson. I will post Part 2 tomorrow. In that segment, I will help you to answer your manager’s question – “How many of these invoices do we process each your?”
Just make me one promise! Do not tell your manager how easy it is to produce these reports!
Of course, I am joking about this. But, most people who do not work with Pivot Tables on a regular basis have no idea how easy it is to harness the analytical and presentation power of Pivot Tables. Once you watch these lessons – and download my video recordings – you will know a lot more about Pivot Tables.
Watch This Video in High Definition on YouTube
Click here to watch this video on my YouTube Channel – DannyRocksExcels – in High Definition


