How to Roll Up a Summary by Month to Filter an Excel Pivot Table

Filter Using a Roll Up by Month Summary

Filter with a Roll Up by Month Summary

In this Excel tutorial, I respond to a viewer request. He likes the new “Roll Up Summary by Month” feature for filtering a field in an Excel 2007 – 2010 Field. What he finds frustrating – there seems to be no natural way to accomplish this with an Excel Pivot Table.

Natural Language Date Filters in Excel

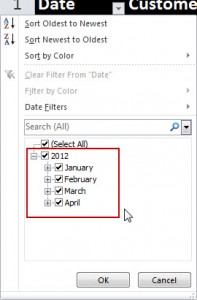
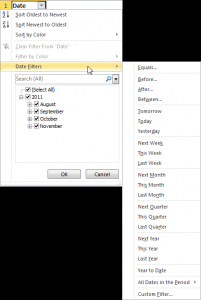
Before I solve my readers dilemma, I demonstrate how to take advantage of the new “Natural Language” Date Filters that were introduced in Excel 2007. Date Filters allow you to filter records from “Today,” “Last Week,” “Next Month,” etc. They are available for Excel Tables and Excel Pivot Tables. These “Natural Language” Date Filters are a major improvement in Excel!

Group a Field for Pivot Tables

To solve my viewers question, I “Grouped” the original Date Field in his Pivot Table to produce “virtual” fields for “Month,” and “Year.” Now, it is a simple step to filter the “virtual” Month Field to obtain a “roll up” filter for individual months in the Pivot Table. Just select a single cell in the Pivot Table Date Field and choose Group Field. Make your choices in the Grouping Dialog Box and you are “good to go!”

I also show you how to take advantage of the Expand and Collapse Field Commands in a Pivot Table.

In-Depth Video Tutorial for Excel Pivot Tables

At my secure, online shopping website, you can purchase my 90-minute Video tutorial for Excel Pivot Tables. Available for immediate downloading or on a DVD-ROM. Version specific editions for Excel 2003, 2007, and 2010.

Watch Video Tutorial in High Definition

Follow this link to watch this tutorial in High Definition Mode on my YouTube Channel – DannyRocksExcels


How to Use the New Natural Language Date Filters in Excel

Natural Language Date Filters

Natural Language Date Filters

Recently, one of my viewers asked me to go into greater detail in demonstrating how the new Natural Language Date Filters work in Excel. Natural Language Filters were introduced in Excel 2007 and they are a great tool to use! Now, instead of writing complex formulas as criteria in Advanced Filters, you can simply click, “Yesterday” to see all of the records from the previous day!

Of course, you must actually have records in your data set for that date!

The Natural Language Date Filters are related, by position, to TODAY(). The TODAY() Function is a “Volatile Function” that returns the value for the current date as found in your computer systems internal clock. The result of the TODAY() Function will change each day. And so, by definition, will the result for a “Yesterday” filter!

Filter for Specific Date

There are several methods that you can use to filter for a specific date or range of dates. One method that I demonstrate in this tutorial is the “Custom Date” dialog box.

Watch Tutorial in High Definition

Follow this link to watch this Excel Tutorial in High Definition on my YouTube Channel – DannyRocksExcels

Learn About My New Extended Length Video Tutorials

I have recently released a series of extended length (90 minutes) video tutorials. They are part of my “Master Excel in Minutes” Series. Each video focuses on one topic. My first video is focused on Excel Pivot Tables. I have created Videos for Excel 2010, Excel 2007 and for Excel 2003. You also have the choice of purchasing the video for immediate downloading or shipped to you on a DVD-ROM.

Follow this link to go to the information page for my “Master Excel in Minutes” video tutorial series.

Download My 75 Minute Video Tutorial on Excel 2007 Pivot Tables

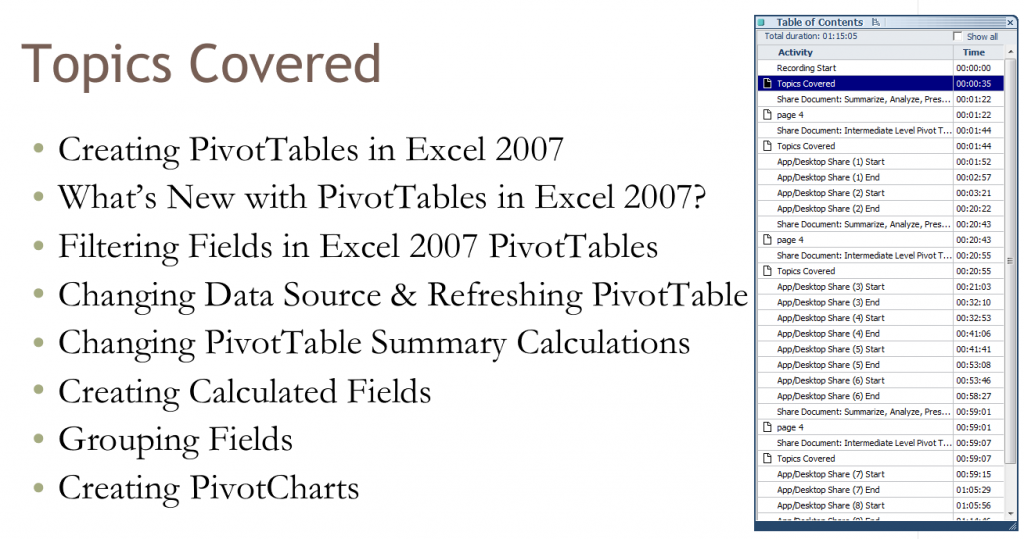
Topics Covered

Table of Contents for Recording

I have just recorded and published a 75 Minute Video Tutorial titled, “How to Create and Modify a Pivot Table in Excel 2007 to Summarize, Analyze and Present the Information in your Data Set.”

It is published on my WebEx by Cisco site: http://thecompanyrocks.webex.com Follow this link to go directly to this recording.

There is a charge for this recording – US$9.95 In addition to the recording you get:

  • A Step-by-step instructional manual
  • Access to the Excel workbook files that I used for this recording

Not to brag , but I think that this video tutorial is excellent! I spent many hours planning out the exercises, working through the timing of each chapter of the video and practicing my delivery. I am happy with the result. And, more important, I think that you will also be satisfied with what you will learn from this recording!

What You Will Learn on My Recording

My goal is to give you a comprehensive understanding of Excel 2007 Pivot Tables. But to give you the opportunity to learn this in “bite-size chunks” that can replay when necessary. I created realistic exercises to illustrate each topic.  Also notice that I have created a Table of Contents for the recording so that you can go to a specific chapter on the recording. You can stop and start at any point.

How to Download this Recording

  1. Go to http://thecompanyrocks.webex.com or click on this link to go to the main menu.
  2. Click on “Recorded Sessions.”
  3. Click the link for the recording, “Excel 2007 Pivot Tables to Summarize Data.”
  4. Register for this session (First Name, Last Name and email address).
  5. Enter payment information (PayPal or Credit Card). This is a secure site!
  6. Follow the instructions to Download my recording.
  7. Recommended – you can also download the ARF Recorder to view the recording.
  8. At this point you can decide to convert the recording to a different format. E.g. WMV (Windows Media Player), SWF (Flash) or MP4 (MPEG4)
  9. At the end of the recording, you are taken to a web page with links to download the Instructional Manual and to download the Excel Workbook that I used during this recoring.

Give Me Your Feedback

I welcome your comments and suggestions for future video tutorial recordings. You can add your comments below or send them to me via email.

How to Filter Excel Data and Save Custom Views

With an Excel data set, you rarely want to view all of the records – hundreds or thousands of records. Rather, you want to view a subset of the data – e.g. Sales of Laptop Computers in June sold by Bob. To do this, you create and apply filters. A filter is similar to a query – you are asking a question and getting the answer – information – from your data. If this is a question that you ask frequently, you can save the filter as a Custom View.

Filter Types in Excel

Filter Types

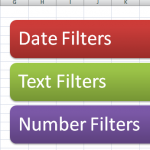
In Excel 2007, filtering has been greatly improved with the introduction of Date Filters, Text Filters and Number Filters. Now it is easy to find the sales for “last week,” or the invoices that will be due “next month,” etc. These new filter types – also available in Access 2007 – allow you get better information quicker from your data set.

Top 10 and Above Average Filters

In this lesson, I also demonstrate how to use the “Top 10” filter. You can also use the new “Above Average” and “Below Average” number filters to quickly find your best performers.

Create Custom Views

There is one “frustration” with Custom Views: If you use Tables in Excel 2007, you cannot use a Custom View. In fact, all Custom Views are disabled if you have a Table on any worksheet in your Excel Workbook.

You can learn more about filtering in Excel – click here to watch my video on Using Advanced Filters in Excel.

Want to watch this video in High Definition, Full-screen Mode? Click here to go to my DannyRocksExcels Channel on YouTube.

View my Video Podcast on iTunes. Click here to go to my iTunes Video Podcast, “Danny Rocks Tips and Timesavers.”

Learn how to “Master Excel in Minutes – Not Months!”