Use an Excel Data Table to See Effect on Multiple Formulas

Excel Data Tables are part of the “What-if” Analysis group of tools and commands. In this lesson, I demonstrate how to use a one-input Data Table to show how substituting a series of inputs effects three separate formulas. This is a powerful – and easy – way to get answers to a series of “What-if” questions.

Data Table

2-Input Data Table

Two-Input Data Table

I know that as I learned how to construct Data Tables, it was a lot easier for me to “see” how to set them up rather than to “read about” how they are set up. You can put your series of substitute values in either the “Column running down” or the “row going across” in the data table. To include the three formulas in the Data Table, I simply included “Links” to the formulas in the original assumptions table.

Learn More About “What-if Analysis Tools in Excel

I have identified “What-if” Analysis as one of my “Nine Essential Skills for Excel.” You can learn more about my 4 hour video tutorial package by clicking on either of these links:


How to Use an Excel Data Table for “What-if” Analysis

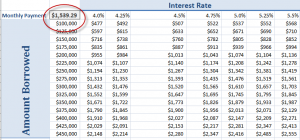
Excel has many tools that give you answers to “What-if” questions. An Excel Data Table allows you to feed a series of “substitute values” into two arguments in a formula. For example, with a Data Table you can:

  • See a table of monthly payments on a loan by substituting both the “Interest Rate” and the “Amount Borrowed” simultaneously.
  • See a table of “Net Payments” by changing both the “Sales Price” and the “Quantity” simultaneously.
  • See the amount that you “tip” a service professional by changing both the “Tip Percentage” and the “Food Total” simultaneously.

As you will see in this Excel Video Lesson, the trick is to understand which series of values are the “Row Inputs” and which series of substitute values are the “Column Inputs.”

Trust me on this: It is easier to “see” how to set up a Data Table than it is to “write a description” of a Data Table. So, I invite you to “see for yourself” how easy it is to set up an Excel Data Table and get answers to two simultaneous “What-if” questions!

Click here to see a Listing of “The 50 Best Tips for Excel 2007.”

Learn how to “Master Excel in Minutes – Not Months!”

Five Benefits from Using Tables in Excel 2007

I really enjoy the major changes that Excel 2007 has incorporated into Tables. In this video I demonstrate Five Benefits when you convert your Excel data lists into Tables.

(Note: This is a re-post. I now make many of my videos available as Podcasts and I need to send these videos to the iTunes store.)

Click here if you would like to subscribe to my Podcast at the iTunes store.

Learn how to “Master Excel in Minutes – Not Months!”

Excel Tells You the Future Value of Your Investment

Hey, want to know what your investment will be worth in 5 years? 10 years? Want a sure thing? Excel correctly calculates the future value of any investment! Provided …

  • You make a series of regular investments – even if it is just one “lump sum.”
  • The interest rate that you earn is “constant” – that is a “fixed annual interest rate.”

OK, so now you understand that neither I nor Excel are “touting sure thing” winners in the stock market. No one can do that. But, you can’t beat Excel when it comes to accurate – and easy to use – financial calculations.

In this video lesson, I demonstrate how to use both the =FV() and =PMT() Functions to calculate Future Values. I also show you how to perform “What-If” Analysis using a One-Input Data Table.

Here are the steps to follow in this Excel Video Lesson:

  1. Input values for Interest Rate (RATE), Number of Periods (NPER) and your Investment (PMT). These are the three required arguments for the =FV() Function. Use the Function Argument Dialog Box to ensure that you use the correct syntax for this function.
  2. One of the “optional” arguments is “Type.” If you omit this, Excel defaults to a “0” which means that you will make your investment contribution at the end of each period. A “1” means that the contribution is made at the beginning of each period. Over a number of years, this can make a significant difference in the “Future Value” of your investment.
  3. FV is also an “argument” in the =PMT() Function. If you want to calculate how much you need to contribute each month to reach a Savings Goal, use the =PMT() Function. However, in this case, the FV – while showing as an “Optional Argument” will refer to the cell containing your Savings Goal.
  4. Create a One-Input Data Table to perform “What-if” Analysis – e.g. to substitute a series of different interest rates in your =PMT() – or =FV() Function.

NEW! Download the Practice File for this Excel Video Lesson:

Find the Excel Video Lesson you want – Index of all Excel Topics

News! My DVD, “The 50 Best Tips for Excel 2007” is now available to purchase. I invite you to visit my online bookstore for more details.