Structured Formula References in Excel 2007 and Excel 2010 – Part 2

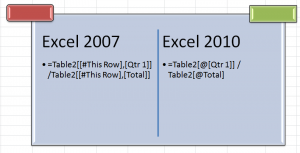
Compare Structered References Excel 2007 v 2010

Compare Structured References 2007 v 2010

This is the second and concluding part of this series where I demonstrate how to use Structured Formula References when referring to Excel Tables.

Key Points Covered

  • The difference between Structured Formula References in Excel 2007 and Excel 2010
  • How to Edit Structured Formula References
  • How to Write Structured Formulas using the new Formula AutoComplete drop-down menu


Watch My Video Tutorial Now


Watch Video in High Definition on YouTube

Click on this link to watch this Video in High Definition on my YouTube Channel – DannyRocksExcels

Go to Part 1 in this Series of Video Tutorials

Follow this link to go to Part 1 in this Series of Tutorials about using Structured Formula References in Excel Tables.

Visit My New Secure Online Store

I have just published 6 New Products and opened a new, revised, secure online shopping website. Take a look at: http://shop.thecompanyrocks.com
 

How to Use the Solver Add-in for Excel – Part 2

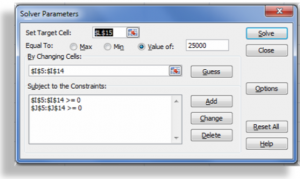
Solver Parameters

Solver Parameters

This is Part 2 of my series of video tutorials where I demonstrate how to use the SOLVER Add-in Tool in Excel to produce a specific result for a formula.  Remember that SOLVER is an Add-in program that you must activate before you can use it. Watch Part 1 in this series to learn how to activate SOLVER.

In this tutorial, I work with the same data set that I used in Part 1. This time, I want to achieve a specific amount of Gross Profit Sales Dollars. First, however, I must determine what is a reasonable amount to set as the Target for Solver to return.

Use SUMPRODUCT Function in Excel

I use the SUMPRODUCT Function to quickly determine my possible Revenue, Cost of Goods Sold and Gross Profit is I sell all of the Units that I have in stock. Now, I have a reasonable Target for SOLVER to reach. SUMPRODUCT is a very efficient Function that, unfortunately, very feel Excel users – in my experience – know about. Follow this link to my Index of Excel Video Lessons to find additional tutorials for SUMPRODUCT.

Best Practice Tips for Solver

  • Work with a copy of your worksheet. This is always a good idea, and it is most important when you are beginning to learn how to work with SOLVER.
  • Write out your Goal for SOLVER.
  • Do you want SOLVER to Maximize the Formula? For example, to Maximize your potential profit?
  • Do you want SOLVER to Minimize the Formula? For example, to Minimize your costs?
  • Do you want SOLVER to return a Specific Number? If so, what is that number?
  • Determine your “Variable Cells.” SOLVER calls them the “By Changing Cells.” These are the cells that SOLVER will automatically adjust.
  • The Variable Cells must “feed int” the formula in your Target Cell – This is the key to making SOLVER work!
  • Write out your “Constraints.” These are the “real-world” conditions that you want SOLVER to operate under. This is the real power in SOLVER.
  • Do not treat the SOLVER results as “the Gospel.” SOLVER is a powerful Business Intelligence Tool. You, however, know your own business or industry. Use SOLVER as a tool to help you to make informed business decisions.


Watch Part 1 in SOLVER Series of Video Tutorials

Watch Tutorial in High Definition

Follow this link to view this Excel Tutorial in High Definition on my YouTube Channel – DannyRocksExcels.

Create a Pivot Chart to Present a Frequency Distribution Report

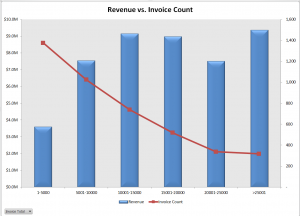
Combination Chart for Frequency Report

Quite a few of my viewers requested that I continue my series of creating and presenting a “Frequency Distribution Report” using an Excel Pivot Table. So, here is the new Part 3 in the series!

In this Excel Video Tutorial, I demonstrate – using Excel 2010 – how to create a Pivot Chart for the Frequency Distribution Pivot Table that I created and modified in Parts 1 and 2 of this series.

Key Point: A Pivot Chart Must be based on a Pivot Table Report!

  • Any structural changes that you make to the Pivot Table are reflected in the Pivot Chart.
  • If you “filter” the Pivot Chart, those filters apply to the Pivot Table that is the basis for your Pivot Chart – and vice versa.

Focus on the Chart

As I demonstrate in this video – posted on YouTube – I prefer to focus on one task at a time. I prefer to get the formatting and structure of the Chart “right” before I think about using Filers and other “goodies to add .” This “Best Practice” helps me to get more accomplished in less time!

My bottom line is: “Focus on the task at hand. Eliminate any possible distractions from that primary task!”

A correctly designed Pivot Chart will help you to present your information accurately and interactively! For this presentation, I decided that a “Combination Chart” would be the best way to present the information that I wanted to convey. A “Combination Chart” allows you to have a Primary Axis (Revenue) that uses a Column Chart Type and a Secondary Axis (Invoice Count) that uses a Line Chart Type.

When to Use a Secondary Chart Axis

In this example, there is a wide difference between the two fields that we are charting:

  • Revenue for the Invoices in the “Bin Range” is in “the millions!
  • Count of Invoices in the “Bin Range” falls into the hundreds and low thousands.

Using a “Combination Chart” in this example – (Column Chart for Revenue in Millions) and Count of Invoices (Line Chart for Count in Hundreds) allows you to present the “relationship” between both metrics. I show you step-by-step how to create this combination chart!


Watch This Video in High Definition on YouTube

Follow this link to view this video tutorial in High Definition on my YouTube Channel – DannyRocksExcels

Click this link to view Part 1 of the 3 Part series – Creating a Frequency Distribution  Report with Excel Pivot Table

Click this link to view Part 2 of the 3 Part series – Formatting a Frequency Distribution Report with Excel Pivot Table

Free Video Recording of Excel Keyboard Shortcuts to Download

I have just published a 50 Minute Video Recording on which I demonstrate the most popular Keyboard Shortcuts for Excel. The great news – for you – is that you can download this video recording for FREE! If you prefer to view this online, you can do so – for FREE!

Download My Excel Workbooks

Download my Workbooks

Download Excel Workbooks

In addition, I have published the Excel Workbooks, Adobe PDFs and PowerPoint files that I use during this 50 minute video online. You can access them – for FREE!

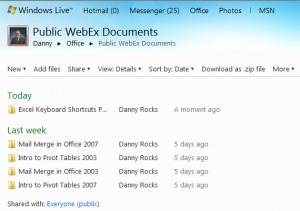
I store them as “public documents” for you to download on my “Sky Drive” at Windows Live! Here is the direct link:

http://cid-644f2f857aa6afdc.office.live.com/browse.aspx/Public%20WebEx%20Documents/Excel%20Keyboard%20Shortcuts%20Part%201

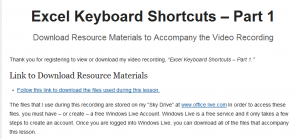
In order to access these files, you will need a “free” Windows Live account (First Name, Last Name, email address). You can also use your HotMail account to login.

My Extended Length Video Recordings on WebEx

I have recently began to publish “extended length” video recordings at http://thecompanyrocks.webex.com – This 50 Minute video is my 5th recording on the site. I offer it to you “free of charge.” However, you must register (fitst name, last name, email address) with WebEx by Cisco before you can download the recording or view the recording online.

In this format, I can offer “specialized instruction” for Excel Pivot Tables, Macros, Public Speaking Courses, etc. I can also offer instruction in older (Excel 2003) and newer (Excel 2010) programs. In addition, I can create a specialized recording “just for you.” Contact me to learn about how to organize this!

Landing Page for More Information

Links for Downloads

Information about Links and Downloads

Rather than repeat what I have already written, here is the link to the special Landing Page that I have created for this 50 minute video recording. On the Landing Page, I have included all of the direct links to the download pages for the video, the Excel files, PowerPoints and Adobe Acrobat documents that I used on this recording.

I invite you to view or download these new resources that I have made available. When you have a chance send me your comments, questions and suggestions for future recordings!

Danny Rocks

The Company Rocks

Watch This Video Lesson in High Definition

Click here to go to my DannyRocksExcels YouTube Channel where you can view this tutorial in High Definition.