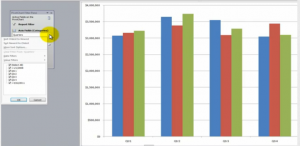
By popular demand, I have created an “Extended Length” ( 69 minutes) video tutorial in Excel 2003 that you can download – for US$9.95 – “Create Pivot Tables in Excel 2003 toe Summarize, Analyze and Present the Information in Your Data.”
Quite a few of my customers and viewers are still using Excel 2003. Are you one of them? If so, this is welcome news for you! If you can even find a video tutorial for Excel 2003, chances are it was created “ages ago.” I incorporate current video technology to view online or to download 69 minute video tutorial that will teach you everything that you need to know to create, modify and present a PivotTable or PivotChart Report using Excel 2003.
What You Will Learn from this Video Recording
Here are the topics that I cover – each as an individual chapter on the recording:
- Creating a PivotTable in Excel 2003
- Filtering and Sorting Fields in an Excel 2003 Pivot Table
- Refreshing your PivotTable; Changing the Source Data for your Excel 2003 PivotTable
- Changing the Functions and Type of Calculations in your Excel 2003 PivotTable
- Creating a Calculated Field in an Excel 2003 PivotTable
- Grouping an Excel 2003 PivotTable Field (e.g. Month, Quarter, Year from a series of Daily Transactional Data)
- Creating and Modifying and Excel 2003 PivotChart
Skip to Individual Chapters on the Video Recording
If you have ever purchased a recording of a “live” Excel Webinar, you know that one frustration is: “How do I get to the specific part of the recording that I want to learn or repeat?”
The last thing that I want you to worry about is “getting stuck” with watching my video recording from start to finish! NO! NO! NO!
That is why I recorded this video webinar with you in mind – I created an easy to follow Table of Contents on the recording so tht you can skip to or repeat an indivual chapter or starting point!
I am confident that you will enjoy this feature!
How to Get Started
- Go to http://thecompanyrocks.webex.com and click on “Recorded Sessions” to see the list of all of my Recorded Video Lessons on WebEx by Cisco.
- Click on this link to open the Video Recording, “Excel 2003 Pivot Tables to Summarize and Analyze Data”
- Register for this recording (First Name, Last Name and email address) so that I can assist you quickly if you need help with downloading the recording or accessing the support materials.
- Enter your payment information US$9.95 using PayPal or a Credit Card – This is a SECURE WEBSITE.
- Download this video recording. I recommend that you:
- Download the WebEx by Cisco ARF Recorder/ Player. Once you have opend the Video Recording, you can convert it to a different format (e.g. WMV (Windows Media), SWF (Flash Format) or MPEG4 (MP4 Format)
- Save the File to a Folder on your hard disk drive.
- Watch the video recording.
Download the Support Material for this Video Recording
Here is a link to the web page that I created for this video recording. Follow the hyperlinks to view online or download the Excel Workbook that I used in this recording as well as the Step-by-Step Instructional Manual that accompanies this recording.
Give Me Your Feedback
As I develop these “Extended Length” video recordings, I seek your feedback. Tell me what you liked. Tell me what you did not like – any why. Send me your suggestions for future topics for my video tutorial recordings.


