Master Excel Pivot Tables in 90 Minutes: Announcing My New Extended Length Video Tutorials!

Master Pivot Tables in Minutes

Master Pivot Tables in Minutes

I am proud to announce the publication of my new series of “Extended Length” video tutorials: “Master Excel Pivot Tables in 90 Minutes!”

Now, you can can get an in-depth video tutorial, so that you can Master Excel Pivot Tables with 90 minutes of video instruction. You also receive the actual Excel Workbook file that I used while filming the video lessons as well as a printed step-by-step instructional manual.

What Makes this Product Unique?

  •  Excel Versions for the Video Tutorials

  • Available for Excel 2010, Excel 2007 or Excel 2003

Multiple Options for Delivery

Resources to Assist Your Learning

  • The Excel Workbook file that I used while filming each video lesson – Included with purchase!
  • PDF Manual of Step-by-Step Instructions – That you can print out – Included with purchase!

Take a Short Video Tour

Follow this link to watch a short – 5 minutes – video tour of my new products on my YouTube Channel – DannyRocksExcels

Visit My New Secure Online Shopping Website

I invite you to visit http://shop.thecompanyrocks.com This is my new online shopping website. I have created secure shopping carts to ensure that your privacy is protected. I also offer a 100% Customer Satisfaction Policy. If, for any reason, you are not 100% satisfied with any of my products, I will refund your purchase with no questions asked!

Danny Rocks

The Company Rocks

Use Excel Pivot Table to Determine Frequency Distribution of Invoice Amounts

Frequency Distribution

Frequency Distribution of Invoices

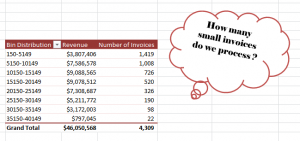
Has your manager ever asked you,  “How many small invoices do we process?” Of course, you do not know that number immediately. However, you can produce the answer within about 2 minutes when you use an Excel Pivot Table.

Amazing?

Group Fields in a Pivot Table

Yes. And, easy to produce thanks to the “Group Fields” tools in an Excel Pivot Table – in any version of Excel!

In fact, I demonstrate how to produce the frequency distribution in:

  • Excel 2010 / Excel 2007
  • Excel 2003

Download My Pivot Table Video Recordings

This give me the opportunity to announce that I have published a series of Video Tutorial Recordings for Excel Pivot Tables – on my WebEx by Cisco website –  that you can download for only $9.95 USD!

Follow this link to get more information and to follow the direct links to download these recordings.

It is so easy to produce this Pivot Table report that you will be amazed – and want to learn more. That is why I have decided to produce a sequel to this lesson. I will post Part 2 tomorrow. In that segment, I will help you to answer your manager’s question – “How many of these invoices do we process each your?”

Just make me one promise! Do not tell your manager how easy it is to produce these reports!

Of course, I am joking about this. But, most people who do not work with Pivot Tables on a regular basis have no idea how easy it is to harness the analytical and presentation power of Pivot Tables. Once you watch these lessons – and download my video recordings – you will know a lot more about Pivot Tables.

Watch This Video in High Definition on YouTube

Click here to watch this video on my YouTube Channel – DannyRocksExcels – in High Definition

Click here to go to Part 2 in this series – Formatting a Frequency Distribution Report for Presentation

Download My Excel Workbooks and Step-by-Step Instructional Manuals for Free!

Finally! I have figured out a way to allow my viewers to download the Excel Workbooks, Word Documents, PowerPoint Presentations, etc. that I use in my video lessons. For the past few months, I have been able to give you a direct link to download the Adobe Acrobat files that I create. For example:

My problem has been that – Starting in Office 2007 –  the underlying file structure of each program (Excel, Word, PowerPoint, etc.) has changed and it is no longer possible to “Publish to the Web” the worksheets, documents and presentations that I offered in the past. I will spare you the boring details of why and how this has happened, because I have good news for you!

Enter, “The Cloud!”

Cloud Computing

You have probably seen or heard this advertising slogan recently. Here is how I have just discovered how “The Cloud” can work for both you and me:

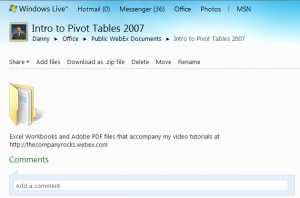
Initially, I am uploading – and sharing – the workbooks, documents, PDFs, etc. that accompany the extended video recordings that I offer on my http://thecompanyrocks.webex.com site.

This is a new development for me and The Company Rocks. I offer a series of extended length ( 25 minute to 60 minutes) video tutorials.

  • Intro to Pivot Tables in Excel 2007

    Information about this Video Recording


  • As I write this posting, I have 4 modules – each offered “free of charge” – for you to view and / or download.
  •  
  •  

Go to http://thecompanyrocks.webex.com to see what I currently offer you!

  • As I gather feedback, activity, statistics, etc. I may extend the range of downloadable content that I create – My decision will depend upon your feedback, so please add your comments below in this posting!
  • My Next Level of Product Offerings 

    I am on a journey to evolve the range and detail of the products and services that I offer you, my loyal viewers and subscribers. I wnat to be responsive to your needs. So, that meanrs that the more feedback that I get from you – my viewers and subscribers – the better I can structure my offerings. I welcome your feedback!

    Based on some great feedback from my viewers and subscribers, I have just begun to create a series of extended length ( 25 to 45 minutes) video tutorials. The initial tutorials will be offered “free of charge.” Other video tutorials will be carry a modest – I might add, aggressive – pricing model! My goal is to give you the product and content that you need at a price that is mutually acceptable! You, and your level of supposrt will tell me what is acceptable – please give me your feedback!

    Extended Video Tutorials Now Online

    You can now view or download – after registering – at WebEx by Cisco – for these video tutorials that I have posted:


    I hope that you find these links and videos helpful. Please add your feeback via the comments section below this post.

    Sincerely,

    Danny Rocks

    www.thecompanyrocks.com

    How to Create a Pivot Table Year-to-Year Comparison Report

    One of my viewers asked for my help in creating and Excel Pivot Table Report. She wants to compare the total number of units shipped during three time periods: the years 2008, 2009 and 2010. The trick to producing this report is to drag the field to be summarized – Units Shipped – to the Values Area three times. Then, you change the Value Field Settings to first Sum the Units, then to compare the change in units year-over-year and finally to express this as a percentage of change. This creates a Year-to-Year Comparison Report.

    This is a tip that is best demonstrated visually. So, I invite you to watch this 6 minute and 55 second Excel Video Training Lesson.

    If you do not have the time to watch the video now, you can use my RSS Feed to deliver it to your computer or you can subscribe to my Video Podcast on iTunes to watch it later.

    Learn how to “Quickly Create Pivot Table Reports and Charts”

    How to Create a Fiscal Year Summary Pivot Table Report in Excel 2007

    This video lesson is related to my previous lesson – “How to Create a Month, Quarter Year Pivot Table Report.” This time, we are using a Fiscal Year.

    I get asked this question frequently. So watch to see how this is done. One hint – your data source must include two fields that contain the Fiscal Year and the FY Quarter.

    You can view and download the Excel video lesson – for free – as a Podcast. Click here to go to my Podcast, Danny Rocks Tips and Timesavers, at the iTunes store.

    If you enjoyed this video, I invite you to shop at my secure online bookstore – http://shop.thecompanyrocks.com – You can purchase my DVD s in the series, “The 50 Best Tips for …”

    Watch this Excel Video Lesson on YouTube

    Related Excel Video Lessons:

    Introduction to Pivot Tables in Excel 2003

    The majority of my clients have not yet used Pivot Tables. They are curious about them, but they are also afraid to get started with them on their own.

    This is the first in a series of training videos designed to guide you in your discovery of Pivot Tables.

    Here are the steps to follow in this video lesson:

    1. Start with an Excel data list that has clearly defined Column / Field Headers. With one cell active, Choose Data, Pivot Table Reports.
    2. You can accept all of the default settings to create a Pivot Table on a new worksheet.
    3. On the new worksheet you see: a) Floating Pivot Table Tool Bar b) Blank Pivot Table Template c) Pivot Table Field List
    4. Experiment by dragging & dropping Fields on to either the Row or the Column areas. Remember that Ctrl+Z (Undo) and Ctrl+Y (Redo) are handy tools to help you as you experiment with the layout that you want to see.
    5. To format numbers in Pivot Tables, double-click the “Sum of YTD Sales” header and in the dialog box select the Number tab to choose your format. This is different from the usual way you format cells. In Pivot Tables, you do NOT format numbers as cells. Rather you format the “Field Settings.”
    6. You can drop the YTD Sales into the Data area a second time. Then in Field Settings, choose a different Summarize by function – e.g. AVERAGE.

    Free Excel 2003 Video Lesson, Workbook and Manual

     I invite you to download a free 28 minute Excel Video Tutorial, Workbook and Instructional Manual for Pivot Tables in Excel 2007 – Follow this Link to my WebEx by Cisco site.

    Find the Excel Training Video that you want –

    Index to all Excel Topics

    My DVDs are now available for sale at my new online store !