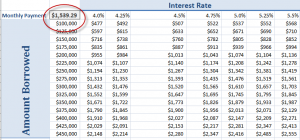
Use an Excel Data Table to See Effect on Multiple Formulas

Excel Data Tables are part of the “What-if” Analysis group of tools and commands. In this lesson, I demonstrate how to use a one-input Data Table to show how substituting a series of inputs effects three separate formulas. This is a powerful – and easy – way to get answers to a series of “What-if” questions.

Data Table

2-Input Data Table

Two-Input Data Table

I know that as I learned how to construct Data Tables, it was a lot easier for me to “see” how to set them up rather than to “read about” how they are set up. You can put your series of substitute values in either the “Column running down” or the “row going across” in the data table. To include the three formulas in the Data Table, I simply included “Links” to the formulas in the original assumptions table.

Learn More About “What-if Analysis Tools in Excel

I have identified “What-if” Analysis as one of my “Nine Essential Skills for Excel.” You can learn more about my 4 hour video tutorial package by clicking on either of these links:


How to Create Scenarios in Excel

Scenarios are part of Excel’s “What-If” Analysis tool set – aka Data Analysis. Use Scenarios when you need to know what the result will be when you change one or more variables in one or more  situations (scenarios).

Frequently, I create Scenarios to define  a “Good, Better, Best” or “Worst Case, Best Case, Case Most Likely” outcome.

In this short Excel Training Video, I demonstrate how to create, edit,  and report four Scenarios for a Monthly Office Expense Budget.

These are the steps used in this Excel Video Lesson:

  • Create (or open) an Excel worksheet that contains a formula. Identify the formula and the precedent  cells that feed into the formula.
  • Select the “target cell” – the cell that contains the formula whose result will change with each Scenario.
  • Choose TOOLS – SCENARIOS and follow the directions in the Create Scenario dialog box.
  • First, click ADD. Name the Scenario. Click OK. Confirm that you have selected the “Target Cell” and then click / type in the “Changing cells.” The Changing cells should be either direct or indirect precedents to the Target cell formula. Click Add. Add additional Scenarios as desired.
  • Click on the name of your Scenario and select SHOW to display the changing cell values and the new result in your target cell.
  • If you wish, choose SUMMARY to create a summary report in a separate worksheet.
  • I strongly recommend that you create named cells and use them in the formulas and changing cells of your Scenario.

NEW! Download the Excel Practice file used in this lesson:

Use my Index to search for the free Excel Training Video that you want to view.

New! Danny’s DVD Training Series, “The 50 Best Tips …” is now available at the online store for The Company Rocks

Related Videos

Goal Seek to optimize the results of the =PMT() function

Here are the steps to follow in this video lesson:

  1. Calculate your monthly payment on a loan using =PMT() function
  2. =PMT() requires three arguments: “Interest Rate” / # of payments per year, “# of payments” over the course of your loan, the “Amount Borrowed.”
  3. For Goal Seek: Select the cell that contains your formula and then choose Tools – Goal Seek.
  4. In the “To Value:” box type in your GOAL – e.g. The amount that you want your =PMT() to return.
  5. In the “By Changing Cell:” select a cell that is referenced in your =PMT() formula.

Find the video lesson that you want – Index to all Excel Video Lessons

“The 50 Best Tips for Excel 2007” DVD is now available to purchase. I invite you to visit my online bookstore for more details.