How to Group People by Age Bracket Using an Excel Pivot Table

Pivot Table for Age Brackets

Pivot Table to Group Age Brackets

In my previous Excel Tutorial, I demonstrated how to use the Group Field command in a Pivot Table to summarize time periods by the Hour. Several viewers wanted to know what other grouping possibilities are available in Pivot Tables. One viewer wanted to know how to group people who responded to a survey by Age Brackets. That is why I created this tutorial!

Use DATEDIF Function to Calculate Age

From my perspective, the DATEDIF() is an invaluable function. However, it is not documented in Excel. Watch how I use its three arguments to calculate the age of each person in the data set.

Group Field by Age

Select a single value in the “Age” Field and then select the “Group Field” Command. In the dialog box, choose the “step-value” for your groups. In this case, I chose the Default Setting of 10 years.

Show Pivot Table Values As

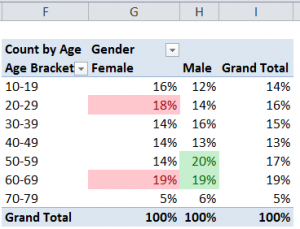
Some of the most powerful Pivot Table tools are found on the “Show Values As” tab of the “Value Field Settings” Dialog Box. Watch me demonstrate how to show each Age Bracket as a Percentage of the Column.

Apply Conditional Formatting to Pivot Table

Take advantage of the greatly improved Conditional Formatting Commands in Excel 2007 and Excel 2010 to focus attention on the key information in your Pivot Table. In this case, I use the “Top 10 Items” rule to apply Conditional Formatting to the two highest Age Brackets- by percentage – for each gender.

Learn Excel Pivot Tables Quickly

Follow this link to learn about the focused 90 minute video tutorials that I have published to help you to really learn how to get the most out of Pivot Tables. Available in versions for Excel 2003, Excel 2007, and Excel 2010.

Watch Tutorial in High Definition

Click on this link to watch this Excel Tutorial in High Definition on my YouTube Channel – DannyRocksExcels


How to Use the Show As Values Dialog Box for an Excel Pivot Table

Show Values As for Pivot Table

Show Values As for Pivot Table

I created this Excel Video Tutorial in response to a viewer who wrote to me about a problem that he was having with an Excel 2007 Pivot Table.

Viewer’s Question

“I want to show both the % of Growth from Fiscal Year-to-Year and the Actual Variance in Volume between each of 3 Fiscal Years. I have been trying to do this with a Pivot Table Calculated Field, but I am not having any luck with this approach. What do you suggest?”

My Solution

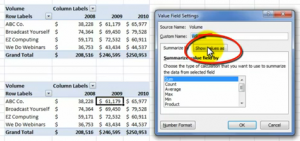
Use the “Show values As” Dialog Box which you find in the Value Field Settings Dialog Box. I continue to be amazed, when I teach Pivot Tables in a Live Seminar, that the high majority of my students have never clicked on this Tab!

In this case, we are working with a “copy” of the original Pivot Table. Simply choose “% Difference From” in the drop-down menu. Next, choose Fiscal Year and Previous (year) to create a Fiscal Year-over_Fiscal Year Report. It is so easy to do! And… you do not have to write a single formula to create this report!

Watch Video Here on My Website


Watch Excel Tutorial in High Definition

Follow this link to view this Excel Tutorial in High Definition Mode on my YouTube Channel – DannyRocksExcels

Master Excel Pivot Tables in 90 Minutes!

Follow this link to learn about my new extended length (90 minutes) Pivot Table Video Tutorials

Use the Show Values As Formulas in Excel Pivot Tables

Show Values As

Show Values As in Pivot Table

I participate in a number of Group Discussion Boards on LinkedIn. In this video tutorial, I address one question that was recently asked:

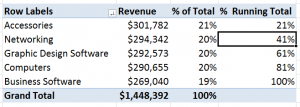
“Is it possible to show a Percentage of Running Total formula in a Pivot Table?”

The answer is, “Yes, if you are using Excel 2010. If you are using earlier versions of Excel, you can use a work-around outside the Pivot Table.”

New in Excel 2010

A great new feature introduced in Excel 2010 is the drop-down menu for the “Show Values As’ in a Pivot Table Calculation. In earlier versions of Excel, the Show Values As option was not so obvious. And, I found that many of my clients did not know how to use it – or could not locate the drop-down menu.

Work-Around for Show % of Running Total

While the “Running Total in…” calculation has been available for quite some time, the “% of Running Total in …” formula is brand new in Excel 2010. The work-around that I demonstrate is to first, create the Show As “Running Total in …” formula. Then change the Font and background of these cells to “White.” Next, write a standard formula “outside of the Pivot Table” that references these cells. Be sure to turn off the “GetPivotData” Formula when you write this formula.

Download Extended Length Pivot Table Video Tutorials

Click on this link to learn about my new “extended length” video tutorials for Pivot Tables. They are availabe for Excel 2003, Excel 2007 and Excel 2010.

Watch Video in High Definition on YouTube

Follow this link to watch this video in High Definition on my YouTube Channel – DannyRocksExcels

Master Excel Pivot Tables in 90 Minutes

Follow this link to learn about my new “Extended Length” – 90 Minutes – Video Tutorials


Formatting an Excel Pivot Table Frequency Report

Show % in Frequency Report

Show % of in Frequency Report

This is Part 2 of my 2-part series on Excel Pivot Table Frequency Reports. A Frequency Report is a great way to answer these questions:

  • How many invoices did we generate for values under $5,000?
  • How many invoices did we gererate for values over $15,000?

In this part, I show you how to format the Frequency Report to make it easier to present the information.

Formatting the Frequency Report

Here are the changes that I made to improve the look of the Frequency Report:

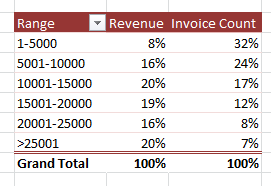
  • Reduced the number of “bins” in the frequency range by changing the “Grouping.”
  • Changed the formatting to make large numbers (millions) easier to read – e.g. as $3.2M
  • Made a copy of the Pivot Table to show values as “% of Total.”

Click on this link to go to Part 1 in this series of video tutorials for Pivot Table Frequency Reports

Learn How to Use Pivot Tables

I have created a series of video tutorials that you can download to learn how to create and modify Excel Pivot Tables. You can choose to download the recording that fits your version of Excel (2003, 2007 or Excel 2010). The cost is $9.95 for the video recording and that includes the Excel workbooks that I used and a step-by-step instructional manual. Follow this link to get more information about these recordings.

Watch this Video in High Definition on YouTube

Follow this link to watch this video tutorial on my YouTube Channel – DannyRocksExcels

How to Create a Pivot Table Year-to-Year Comparison Report

One of my viewers asked for my help in creating and Excel Pivot Table Report. She wants to compare the total number of units shipped during three time periods: the years 2008, 2009 and 2010. The trick to producing this report is to drag the field to be summarized – Units Shipped – to the Values Area three times. Then, you change the Value Field Settings to first Sum the Units, then to compare the change in units year-over-year and finally to express this as a percentage of change. This creates a Year-to-Year Comparison Report.

This is a tip that is best demonstrated visually. So, I invite you to watch this 6 minute and 55 second Excel Video Training Lesson.

If you do not have the time to watch the video now, you can use my RSS Feed to deliver it to your computer or you can subscribe to my Video Podcast on iTunes to watch it later.

Learn how to “Quickly Create Pivot Table Reports and Charts”

Changing Pivot Table Summaries in Excel 2007

In this Excel Video Lesson I demonstrate how to show an additional Pivot Table Summary, “Percentage of Total,”  alongside a traditional ( Sum of Amount) subtotal. It is easy to do – if you know where to look. In the Field Settings Dialog Box for your Pivot Table, click on the “Show Values As” tab and then select the option that you want from the drop-down listing. In this lesson I use “% of Column.”

Watch me demonstrate how to do this.

If your want to learn the best tips for Excel, I encourage you to purchase my DVD – “The 50 Best Tips for Excel 2007.” Click here to enter my secure shopping site and make your selection. I guarantee your satisfaction 100%. If you are not satisfied, then I will refund your purchase price.

Additional Resources

Extended Length – 90 Minutes – Video Tutorials for Excel Pivot Tables now available – Download or on DVD-ROM

You can view – and download – this video on YouTube. I welcome you to subscribe to my YouTube Channel, DannyRocksExcels

Learn how you can “Quickly Create Pivot Tables” in Excel

Related Excel Training Videos