Three and a Half Ways to Average Excel Data Using Criteria

AverageIf Function in Excel

AverageIf Function in Excel

It is easy to use Excel’s AVERAGE Function to get the average for an entire range of data. But, what if you are asked to produce a report that shows the average for select groups of records – for example, average test results for the female students only; or for the male students only? What approach do you take? What Functions do you use to produce this report?

Three and a Half Ways to Produce this Report

  • SUBTOTALS – Easy to use. Remember to sort your data first using the field that you want to subtotal.
  • AVERAGEIF Function – Very easy to use. Only works in Excel 2007 and Excel 2010.
  • DAVERAGE Function – Will work in any version of Excel. Easy to add or change the Criteria.
  • PIVOT TABLE – Very easy to create. No need to write a formula. Create report with @ 6 mouse clicks!

My Preferred Approach – Create a Pivot Table Report

While Pivot Tables are the most powerful tool in Excel, they are also one of the easiest tools to use in Excel! Why?

  • Because you can create a Pivot Table Report without writing a single formula!
  • You can create this Pivot Table Report with about six clicks of the mouse.
  • You cannot possibly harm your underlying data when you create Pivot Tables!

Download a One Hour- Plus / In-depth Video Tutorial on Pivot Tables – for $9.95

I have created a series of Excel Video Tutorials that you can download for $9.95 US Dollars each. Here is a link to my informational page that gives you the details.

  • Are you Using Excel 2003? – I created a video recording for Pivot Tables using Excel 2003 that you can download for $9.95!
  • Are you Using Excel 2007? – I created a video recording for Pivot Tables using Excel 2007 that you can download for $9.95!
  • Are you Using Excel 2010? – I created a video recording for Pivot Tables using Excel 2010 that you can download for $9.95!

As with all of my products, I guarantee that you will be 100% Satisfied or I will refund your purchase price – no questions asked!

My Extended length Excel Training Video Recordings are hosted at: http://thecompanyrocks.webex.com – I use the secure shopping cart at WebEx by Cisco Systems, so you can be sure that your personal information is safe and secure.

Watch Video in High Definition on YouTube

Follow this link to watch this video tutorial in High Definition mode on my YouTube Channel – DannyRocks Excels

Get My DVD-ROM, “The 50 Best Tips for Excel 2007” for only $29.97

Don’t Subtotal Excel Data, Use Subtotal Function Instead

Subtotal Function

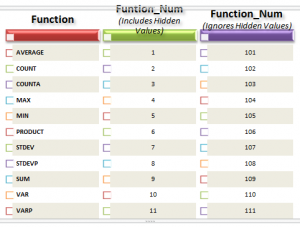
Subtotal Function Numbers

I used to love creating Subtotaled Reports. They are useful. They are easy to create. But they are also “clunky.” In my opinion, there are too many steps to take when you wish to see a Subtotal for a different field or to use a different function in your Subtotals.

Let me introduce you to the Subtotal Function in Excel. Here are several ways to take advantage of this function:

  • You can place the Subtotal Function in any cell on your worksheet – it does not have to reside directly below your data field.
  • You can use the Subtotal Function in connection with Data Filters – to get the subtotal for the visible cells in a filter.
  • You can use any of the 11 functions available to the Subtotal Function (Sum, Average, Count, etc.)

Watch This Video in High Definition on YouTube

This file size for this video is a little bigger than usual. So, to watch it, click on this link to view it in High Definition Mode on YouTube.

Subtotal Function Part Two

I have decided to film a second video lesson on the topic of the Subtotal Function – Using Subtotal Function in Excel Tables and Lists. Click on this link to watch my second video on this topic.

Watch or Download My 24 minute Introduction to Pivot Tables Video Recording

I have started to posted a series of “extended length” video tutorials online at: http://thecompanyrocks.webex.com – Follow this link to get more information about viewing or downloading my “free” Introduction to Pivot Tables.”

Get my best-selling DVD-ROM, “The 50 Best Tips for Excel 2007” for only $29.97!

Produce Subtotals for your data

Here are the steps to follow in this lesson:

  1. Sort your data according to the field (column) by which you wish to group your records.
  2. From the DATA menu select SUBTOTALS.
  3. In the Subtotals dialog box confirm the correct field and select the FUNCTION you wish to use. There are 11 possible functions (including SUM, AVERAGE, MIN, MAX)
  4. Check to FIELDS that you want to be subtotaled and then click OK.
  5. Excel automatically OUTLINES your data. Click the Expand and Collapse buttons on the outline to see more or less detail. Click the Outline Levels to see different views of your subtotals.
  6. Explore the other options in the Subtotal dialog box (First choose Data – Subtotals.)
  7. You can remove ALL Subtotals in the Subtotal dialog box.

NEW! Download the Excel Practice file that I use in this video:

Find the video lesson that you want – Index to all Excel Topics

News! My DVD, “The 50 Best Tips for Excel 2007” is now available to purchase. I invite you to visit my online bookstore for more details.

Related Video Lessons