Functions to Analyze Loan Payments in Excel

Loan Payment Functions

Loan Payment Functions

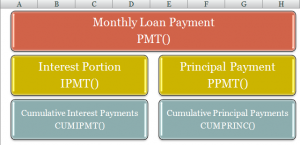
When you use the PMT Function in Excel, the result is the amount of money that you will pay each period (usually monthly) until the loan is repaid. When you want to know how much of each payment is an interest charge, you use the IPMT Function. And,to find the amount that goes towards reducing the principal on your loan, you use the PPMT Function.

Cumulative Payments

Two other functions are helpful in analyzing your loan payments. When you want to see the Cumulative amount of Interest (CUMIPMT Function) that you paid between two periods – e.g. Starting with payment 1  and ending with payment 12. You use the CUMPRINC Function to total the amount of your loan payments that went towards reducing the principal on your loan between any two periods.

Absolute and Relative Cell References

As you will see in the video, I use a combination of Absolute Cell References (e.g. $A$4) and Relative Cell References (e.g. A4) in these formulas. An Absolute Cell Reference means that cell will “remain in place” when the formula is copied down or across to other cells. In this example, I have my Loan Information (Amount to borrow, Interest Rate, etc.) at the top of the spreadsheet. Almost all references to these cells in formulas is Absolute.

Function Arguments Dialog Box

I almost always use the Function Arguments Dialog Box when I am creating my formulas. I use the Keyboard Shortcut, Ctrl + A at this point in the formula – “=PMT(” to activate the dialog box. The advantages of using the Function Arguments Dialog Box are:

  • Explanation of both the function and each “argument” in the function
  • Ensures arguments are answered in the proper sequence
  • Ensures that all “required” arguments (Argument Labels are in Bold)
  • Evaluates the result of each “intermediate” calculation – to the right of each argument

This is the first of several Excel Video Lessons that I am creating to demonstrate how to perform Financial Calculations. Let me know what you think or send me your questions to answer. You can add a comment below this post.

Watch This Video in High Definition on YouTube

Follow this link you view this Excel Video on my YouTube Channel – DannyRocksExcels

Download Excel Workbook

Follow this link to download the Excel Workbook I used in this lesson.

Subscribe to My Video Podcast

I invite you to receive an automatic notice – via email – whenever I publish a new Excel Video Lesson. Follow this link to find out the details. The subscription is free; you do not need to provide and personal information beyond your email address; and you can cancel at any time – no questions asked!
Dynamically Update a Cell with an Excel Worksheet Name

Formula to Capture Worksheet Name

Capture Tab Name in Cell

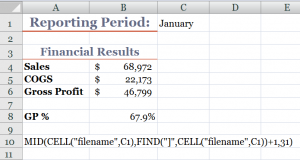
I am excited to share this Excel Tip with you! Several viewers have recently asked if there was a way to create a link in a cell to the name of a worksheet tab. Yes there is! And, in this lesson, I demonstrate how to do this.

Say, for example, that you want Cell C1 to contain the name of the current worksheet (Sheet1). With this formula, when you change the name of the worksheet to “January,” cell C1 is dynamically updated to show “January.”

Perfect for Excel Templates

If you use a template for your monthly, regional sales or financial reports, then this Excel formula is essential. You write the formula once – using Group edit – and each worksheet in your Excel workbook will be linked to a cell in your report. Change the name of the worksheet and your report name is automatically updated.

Functions Used in this Formula

  • CELL() – to gather information about the worksheet – in this case, the “Filename.”
  • MID() – to extract the characters in a text string – e,g, the “worksheet name.”
  • FIND() – to locate the starting point for the MID() function to extract the characters in the text.

As the final argument for the MID() Function, I use 31 characters because that is the maximum number of characters that you can use when naming an Excel worksheet.

Try this for yourself. Let me know how it works for you. Add your comments below.

Download Excel Workbook for this Lesson

Watch Video in High Definition

Follow this link to view this video tutorial on my YouTube Channel – DannyRocksExcels

I invite you to watch or to subscribe to my video podcast on iTunes. Follow this link to learn more about my RSS Feed.

How to Use Text Functions in Excel

Text Functions in Excel

Text Functions

In my experience, I find that many of my clients do not realize that Excel has many powerful – and easy to use – Text Functions.

Even more amazing, I observe clients spending hundreds of hours and thousands of dollars “re-keying” or “manually editing” text entries that have been downloaded from a Main Frame Computer. If you – or your colleagues – have been doing this, you will want to watch this Excel Video Tutorial.

Categories of Text Functions in Excel

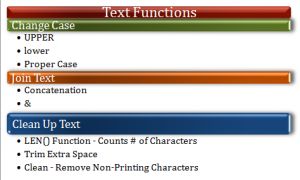
In this Excel video lesson, I demonstrate how to use three categories of Text Functions:

  1. Transform Text – Use the UPPER, lower and Proper functions to change the “Case” of a text string.
  2. Join Text – Use either the CONCATENATE() Function or the & (Ampersand) Operator to join two or more text strings into a single text string.
  3. Clean-up Text – Use the LEN(), TRIM() and CLEAN() Text Functions to “trim the fat” from text strings – especially those that you download from a Main Frame Computer.

Once again, in my experience, I have too many clients contacting me in a panic because they get a REF# error when using Text Functions. I demonstrate how to recover from a “seeming disaster” and also how to use COPY – PASTE SPECIAL – VALUES to transform Formulas into Constant Values.

I welcome your feedback. Please send me an email: danny@thecompanyrocks.com – to let me know if this tip helped you to save time and money. I also welcome your suggestions for future Excel Video Lessons to create and post here, on my website.

Watch This Excel Video Tutorial in High Definition Mode

Follow this link to view this Excel Video Lesson in High Defintion Mode on my YouTube Channel – DannyRocksExcels

Download the Excel Workbook

Follow this link to download the Excel Workbook I use in this lesson.

Learn How to Master Excel in Minutes – Not Months!

If you like this Excel Video Tutorial, I invite you to learn more about the resources that I offer to help you to improve your Excel skill set.

Learn How Excel Calculates Formulas

Order of Calculations in Excel

Excel Calculation Order

Have you ever written a Formula in Excel only to receive a result that was different from the one you expected? Most Excel users have shared that experience from time to time! Excel is smart and fast. However, it can not read your mind.

In this lesson, I show you how Excel evaluates and calculates a formula. Once you understand “Excel’s perspective” of the formula, you will know how to correctly write the formula so that Excel will produce the result that you intended. In other words, to see the formula from “your perspective!

Order of Precedence

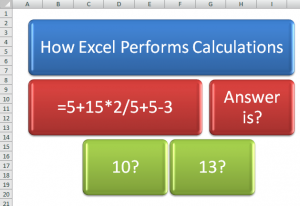
Excel performs calculations in formulas moving from left to right in this order:

  1. Performs Multiplication (*) and Division (/)
  2. Goes back and performs Addition (+) and Subtraction (-)

This is the “key” to consistently getting Excel to produce the results that you intended. No, you can’t get Excel to make you an “instant millionaire” or do anything illegal. However, understanding how to write formulas correctly – so that you control the order of calculation in Excel – is the “secret sauce!”

Control the Order of Calculation in Excel This formula: =5+15*2 results in 35. If you were expecting the result to be 40, then write the formula as (5+15)*2. In other words, take the “result” of 5+15 or 20 and multiply this by 2 to give me 40.By using parentheses (5+15) you take control over the order of precedence that Excel uses. Help Excel to see the formula from your perspective!

Free Chart of Excel Formula Operators

I have published  a chart – “Using Operators in Excel Formulas” – To get your free copy as a PDF, click on the link below:

CR – Using Operators in Excel Formulas

Explore My Free Excel Video Lessons

Follow this link to my Index of Free Excel Video Tutorials

Watch This Video Tutorial In High Definition

This link will take you to the DannyRocksExcels video on YouTube

How to Search For and Use Text Strings in Excel

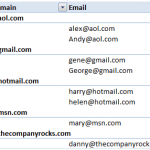
A viewer asked for my help in creating a report that will group his customers’ email addresses by their “domain name.” For example, he wants to be group all customers with gmail addresses . Likewise, his  customers’ yahoo mail, aol.com accounts, etc.

Pivot Table for Email Domains

Pivot Table Email Domains

I immediately decided to use two powerful Excel tools to produce this report:

  1. Text-to-Columns to create two columns (name and domain) from one text value (the email address).
  2. Pivot Table Report to group and present customer emails by domain name.

Both tools work great and I produced the report with only a few mouse clicks!

The response that I got from my viewer was, “That’s great Danny. But …”

It turns out that the viewer wanted to have the Domain Names as the Field Headers and to show each customer’s email address as a row going down vertically in the corresponding field. To give my viewer the report that he wanted, I used these tools and techniques:

  • I returned to the Pivot Table to copy the unique list of domain names.
  • I used Paste Special – Transpose to convert the vertical list of domain names into a horizontal row of Field Headers.
  • I began to build my “Mega-formula” by taking “baby steps” – i.e. I created one formula and then “nested” it inside additional formulas and functions.
  • For the first “baby step” formula I used the SEARCH() Function.
  • Next, I “nested” this formula as the “logical test” inside an IF() Function.
  • In order to “hide” all of the formula error signs, I nested both of these functions inside the NEW IFERROR() Function.
  • IFERROR() was introduced in Excel 2007 and I now consider it to be “indispensable!” This function, alone, makes upgrading to either Excel 2007 or Excel 2010 a “nobrainer” decision!

I enjoy answering questions from my viewers. Many of these questions can be answered from one of the lessons on my DVD-ROM, “The 50 Best Tips for Excel 2007.” For the rest, I try to create a video lesson that demonstrates how to get the answers that you – my viewers and customers – are looking for.

Keep your questions and suggestions coming! I enjoy receiving feedback from you!

I invite you to subscribe to my RSS Feed on Feedburner to be automatically notified whenever I publish a new Excel Video Tutorial.

Watch this Excel Video in High Definition on YouTube

Here is the link to watch this video on my YouTube Channel – DannyRocksExcels

How to Take Advantage of Report Filters in Excel Pivot Tables

Starting with Excel 2007, Pivot Tables now include a “drop field” labeled “Report Filters.” The Report Filters area replaces the area labeled the “Pages” drop area in Excel 2003 and earlier. Report Filters is a more descriptive and intuitive name. So , this is a welcome change.

How to Organize Pivot Table

Use Report Filters in Pivot Table

In this lesson, I am responding to an additional request from one of my viewers who wants me to demonstrate how the “Report Filters” drop zone will provide incredible reporting power in a Pivot Table.

Request from a Viewer

In this lesson, my viewer is a “hydrologist” who analyzes average Water Flows by day and by month in a “Water Year.” If you use a “Fiscal Year” reporting structure, you will want to pay attention to this lesson. In this case, the “Water Year” begins on October 1 and ends on September 30. My viewer needs my help in separating out individual Pivot Table Reports organized by Water Year – placed in the Report Filters Drop Zone.The Pivot Tables show the average daily water flow by date. He told me that he is concrned that that Pivot Table Report may not be able to “account for Leap Years.”

Not to worry!

Watch this Excel Video Tutorial, as I demonstrate how to answer my viewer’s query and also give you some “solid tips” to get the results that you need when using Excel!

Watch this Excel Video Tutorial in HD Mode on my YouTube Channel

Here is the link to my YouTube video channel for this video.

Learn how to “Quickly Create Pivot Table Reports!”

Use SumIf and SumIfs Function in Accounts Receivable Status Report

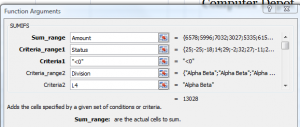
I receive many requests from viewers to help them to create and to analyze “Accounts Receivable Reports.” So, I created this Excel Video tutorial to demonstrate how both the SUMIF and the SUMIFS Functions can help you to analyze the data in an AR Status Report.

The SUMIF() Function has been available for many years in Excel – and it is a great function to use. However, starting in Excel 2007, we now have the expanded SUMIFS Function which allows us to evaluate multiple ranges using multiple criteria to return the sum of our results. This is a terrific improvement!

SUMIFS Function

SUMIFS in Excel 2007

Use SUMIFS() Function

With the SUMIFS Function, you no longer have to create multiple, complicated “nested IF Functions. Rather. you use a series of “paired arguments” – Criteria Range1, Criteria1″ etc. to define the result that you want to return.

So, with the SUMIFS() Function, you can use “paired” Criteria Ranges and Criteria to produce the exact results that you are seeking!

This, alone, may be one of the reasons to upgrade to either Excel 2007 or to Excel 2010!

Watch this Video in High Definition mode on YouTube

Here is the link to view this Excel lesson in High Definition on my YouTube Channel

You can learn how to “Master Excel in Minutes – Not Months!”

How to Use the Average Functions in Excel 2007 and 2010

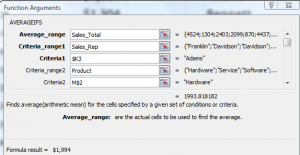
The new AVERAGEIF and AVERAGIFS Functions were introduced in Excel 2007. In this lesson, I demonstrate how and when to use both functions. If you are using an earlier version of Excel – e.g. Excel 2003, I show you how to use a Pivot Table to produce the same results.

Average is not the Median

The Average Function is the “Arithmetic Mean” of the range of cell values. This means the Sum of the values in the range divided by the Count of the cells with numeric values in the range. Many people confuse this with the MEDIAN sale which is the “middle value” in the range. Half of the cell values are above and half of the cell values are below the result of the MEDIAN() Function.

New AverageIfs Function in Excel

AverageIfs Function

New Functions in Excel 2007

Watch the video to see how to use both the AverageIf and AverageIfs Functions. I recommend using the Function Arguments Dialog Box and Named Cell References with these functions. Pay attention to my use of “Mixed Cell References” in the AverageIfs formula. Doing so makes it easy to write the formula in one cell and then copy it across the range of cells.

Here is the link to watch this video tutorial in High Definition on my YouTube Channel.

Learn how you can “Master Excel in Minutes – Not Months!”

How to Sort Using a Custom List in Excel

What happens when you sort a list of Months in the Year in Ascending Order? You will get “April, August …, etc.” And that, I guarantee, is not what you want! So, how do you get the list to sort as “Jan, Feb, Mar, … etc.?

Sort Using a Custom List

Sort on Custom List

Sort on Custom List

The months of the year and the days of the week are Custom Lists that are built into Excel by default. You can also create your own Custom Lists – e.g. a list of department in the order that you want to see them displayed. Once you have a Custom List saved in Excel, you can choose to sort using this order.

Watch this short video lesson to see how to create a Custom List and also how to Sort Using a Custom List in Excel.

High Definition, Full Screen Mode on YouTube

Here is the link to watch this video on my YouTube Channel – DannyRocksExcels

Learn More About Custom Lists in Excel

I have identified “Creating Custom Lists to AutoFill and Sort By” as an Essential Skill in Excel. I have created a four-hour comprehensive video training package that covers the “Nine Essential Skills in Excel.”  Click on these links to learn more about my video training resources:

How to Generate Multiple Reports from One Pivot Table

You can create an Excel Pivot Table with just a few mouse clicks. And, with just a few more clicks, you can change – or pivot – the design of your report. Most people who use Pivot Tables know this. However, I find that most Excel users do not know that you can generate multiple reports – each one on  a separate worksheet – with just a few clicks. This is a tremendous time-saving tip!

Generate Multiple Reports

Multiple Reports

Pivot Table Report Filters

When you place one or more fields in the “Report Filters” drop zone of your Pivot Table, you will be able to generate multiple reports from one Pivot Table. Report Filters were introduced in Excel 2007. If you use an earlier version of Excel, this drop zone is called, “Pages.” Report Filters allow you to create interactive views of your data. If you use Dashboard Reports, you will want to include Report Filters in your Pivot Table.

In this video, I demonstrate how to generate reports – each on an individual worksheet – for the values in your Report Filter Field. Whenever I demonstrate this technique in a class or to a client, I always get a “gasp of excitement.” Most people say, “That’s incredible. Do that again!”

Create a Calculated Field

I also show you how to Create a Calculated Field in a Pivot Table. You do not need to return to your source data to add additional fields and then recreate your Pivot Table. Why keep redundant data? Rather, create as many Calculated Fields as you need in your Pivot Table.

Copy Your Pivot Table

You can prevent “Pivot Table Bloat” when you make copies of a Pivot Table rather than creating brand new Pivot Tables from the same source data. Watch as I demonstrate how to do this.

Follow this link to learn how you can “Quickly Create Pivot Tables and Charts”

Here is the link to watch this video in High Definition on my YouTube Channel, DannyRocksExcels